Prometheus-AlertManager-Supervisor-钉钉告警
date
Jan 25, 2024
slug
Prometheus-AlertManager-Supervisor
status
Published
tags
Tech
summary
Prometheus 是由 SoundCloud 开源的监控告警解决方案。基于Prometheus,我们可以按时间间隔定义采集任务,用拉取的方式去采集各个服务应用上的性能指标,再配合Grafana对采集到的指标进行可视化展示和查询分析
type
Post
是否完成
是否完成
主题
发布平台
状态
前提
Prometheus 是由 SoundCloud 开源的监控告警解决方案。基于Prometheus,我们可以按时间间隔定义采集任务,用拉取的方式去采集各个服务应用上的性能指标,再配合Grafana对采集到的指标进行可视化展示和查询分析。Prometheus和Grafana都支持报警规则,可以通过Webhook能把报警信息推送到钉钉群里,及时响应异常情况。依我的理解,Prometheus的报警规则是支持job级别和指标级别的,Grafana只支持指标级别的。本篇介绍的是Prometheus的报警规则,监控Job服务是否正常运行,Supervisor用于进程管理。以下所描述的内容是假定你已经正常安装Prometheus,并正常运行了至少一个Job服务。
工欲善其事,必先利其器
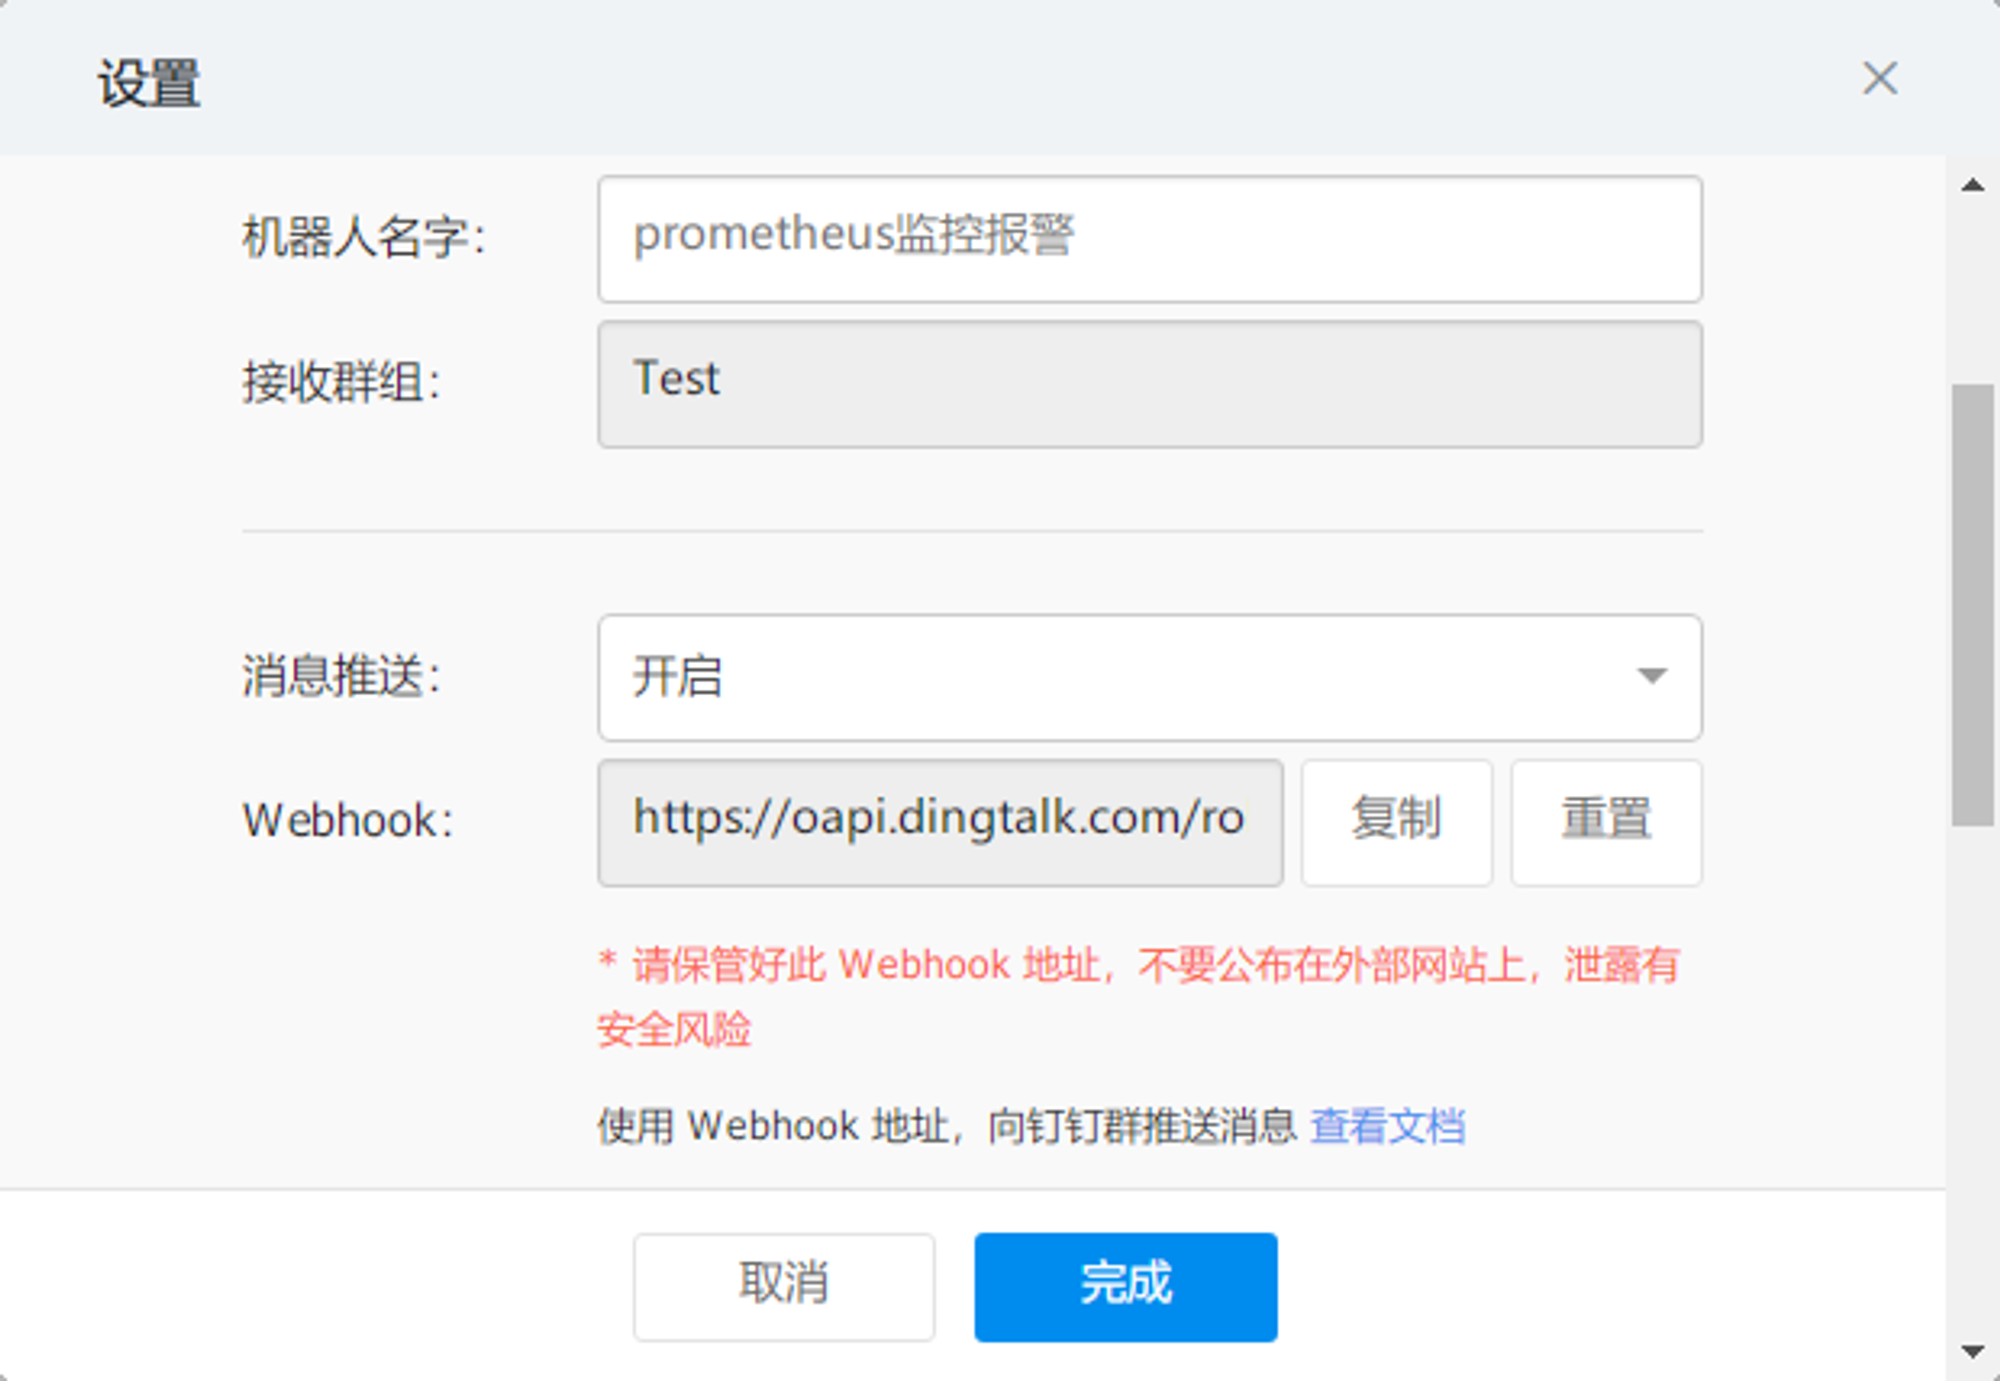
需要准备的工作包括:钉钉机器人的webhook、Prometheus-webhook-dingtalk和AlterManager
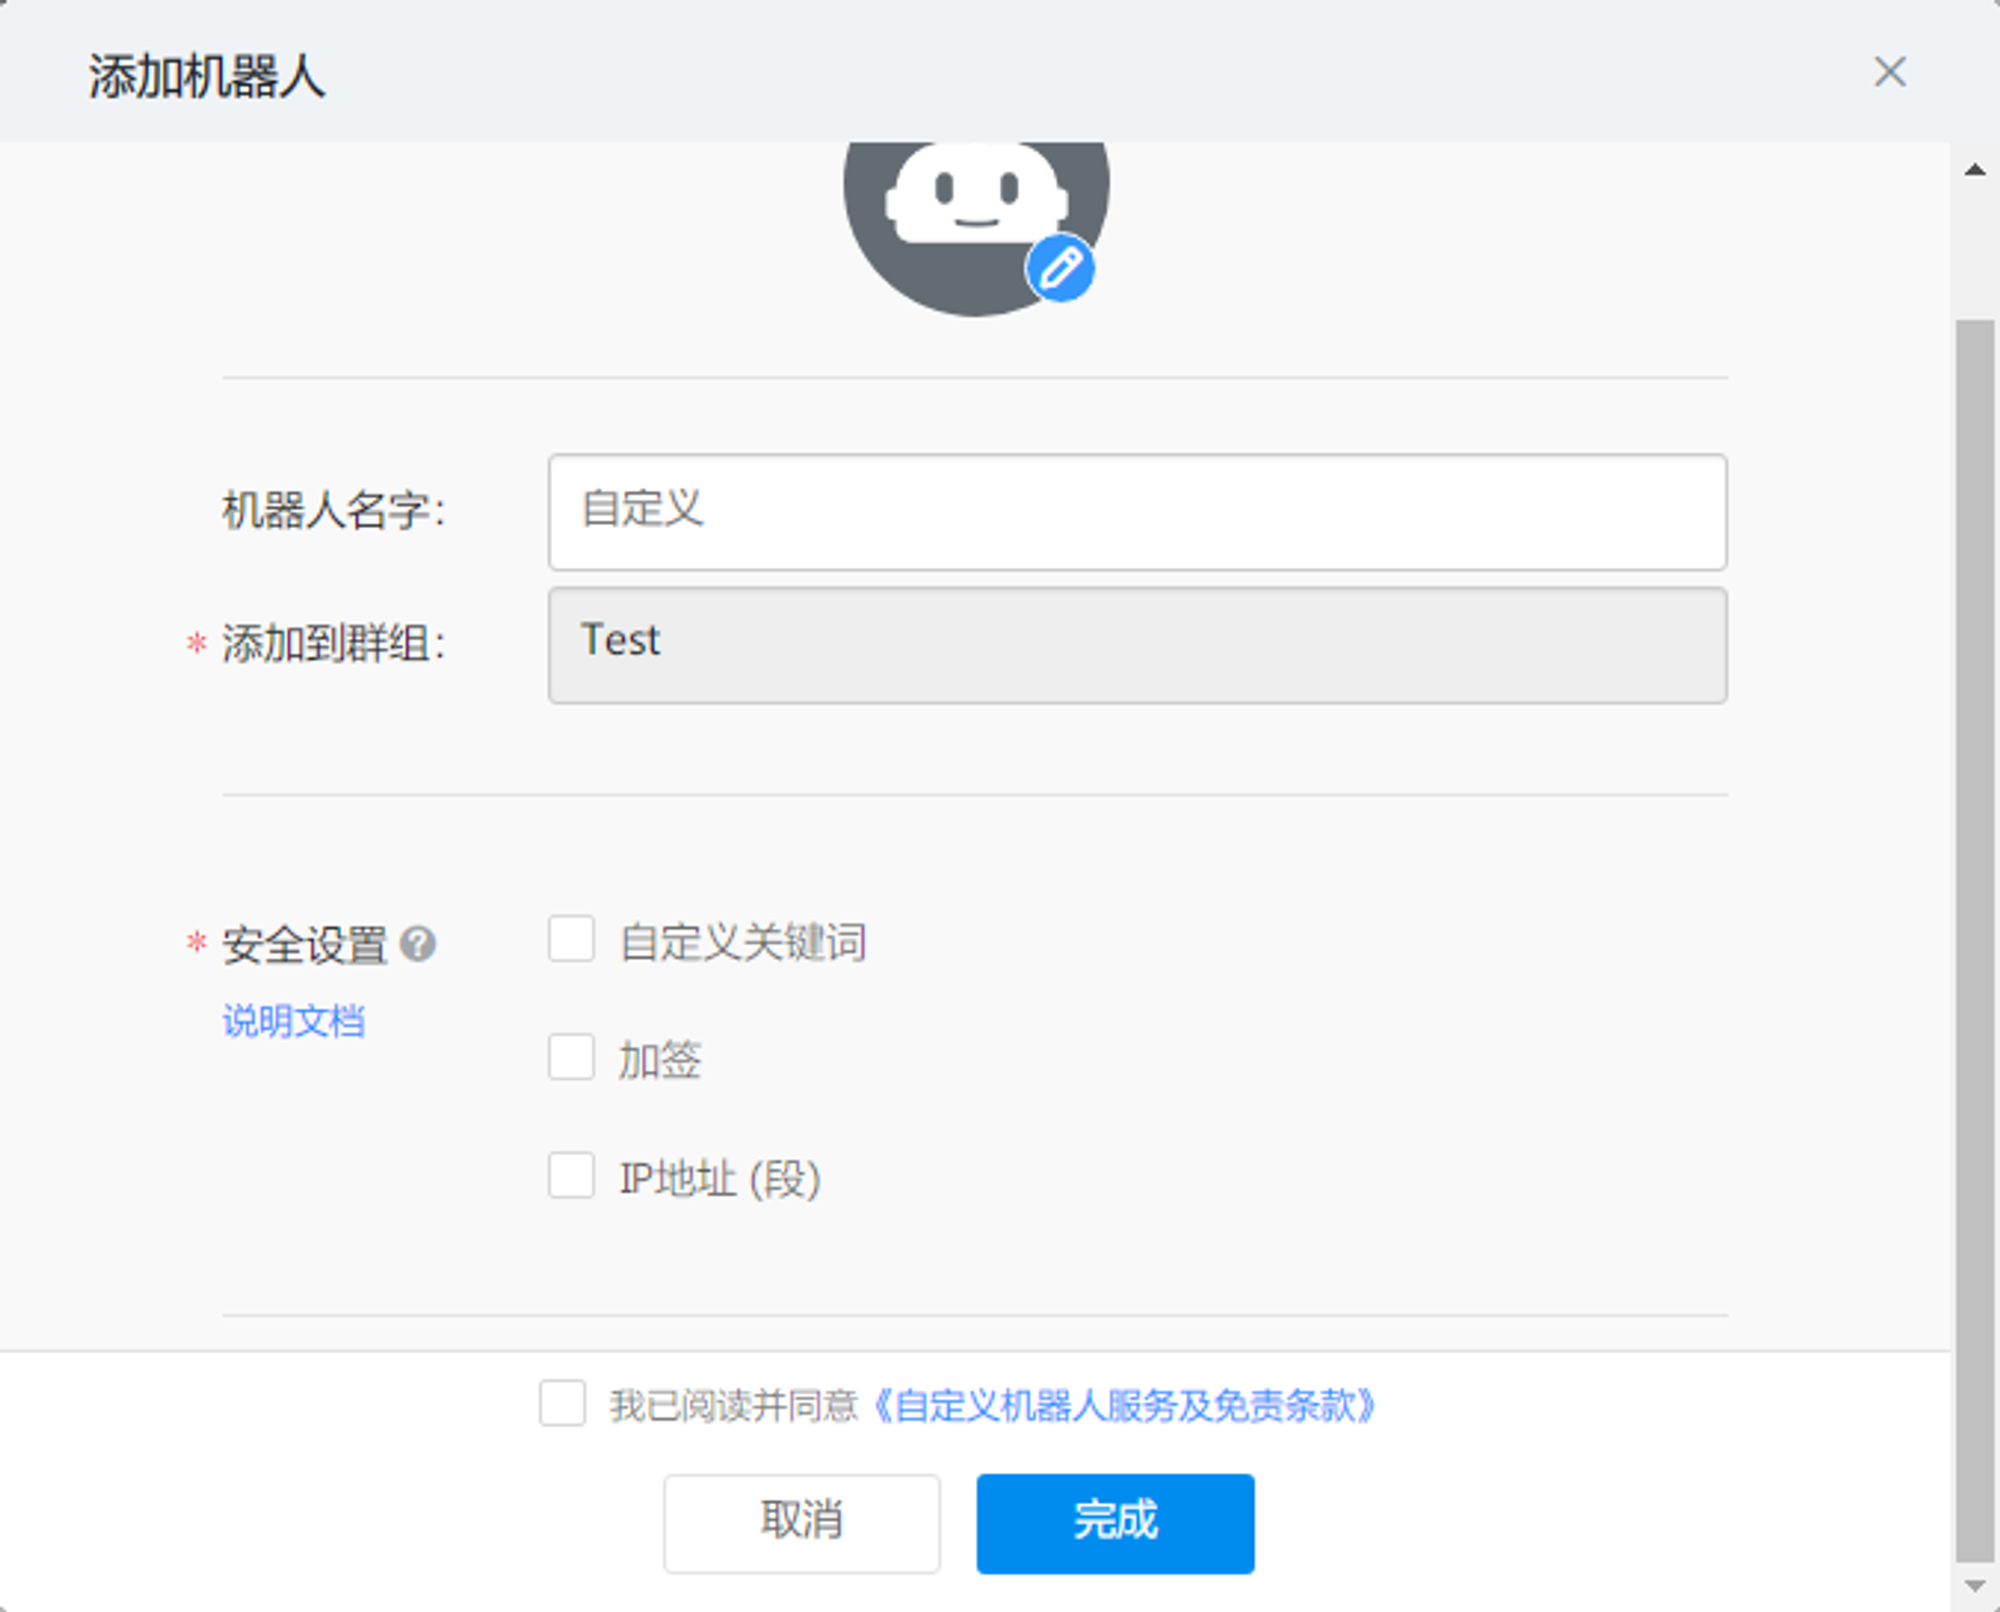
钉钉添加机器人
可以参考官网

Prometheus-webhook-dingtalk
插件官网

下载解压prometheus-webhook-dingtalk-1.4.0.linux-amd64.tar.gz
wget https://github.com/timonwong/prometheus-webhook-dingtalk/releases/download/v1.4.0/prometheus-webhook-dingtalk-1.4.0.linux-amd64.tar.gz
tar -zxvf prometheus-webhook-dingtalk-1.4.0.linux-amd64.tar.gz
启动prometheus-webhook-dingtalk,这里使用Supervisor进行后台启动
进入supervisor安装目录,在conf.d/下新建prometheus-webhook-dingtalk.conf
vim prometheus-webhook-dingtalk.conf
配置prometheus-webhook-dingtalk.conf
- /xxx/prometheus_webhook_dingtalk/prometheus-webhook-dingtalk:prometheus-webhook-dingtalk启动脚本路径
- -web.enable-ui:启动ui,默认端口为9093
- -ding.profile:钉钉机器人的webhook地址,前面加上webhook1
[program:prometheus_webhook_dingtalk]

command = /xxx/prometheus_webhook_dingtalk/prometheus-webhook-dingtalk --web.enable-ui --ding.profile="webhook1=https://oapi.dingtalk.com/robot/send?access_token=xxx"
directory = /xxx/prometheus_webhook_dingtalk
user = root
startsecs = 5

redirect_stderr = true
stdout_logfile_maxbytes = 10MB
stdout_logfile_backups  = 3
stdout_logfile = /xxx/supervisor/logs/prometheus_webhook_dingtalk.log
autostart=true
autorestart=true
supervisorctl update进行进程的启动,如果出现错误可以查看/xxx/prometheus_webhook_dingtalk.log
启动后从日志中可以看到用于接收告警信息的webhook的地址为:http://localhost:8060/dingtalk/webhook1/send
supervisorctl status 查看prometheus_webhook_dingtalk是否正常启动。
下面开始进入正式的配置环节:
Prometheus
修改prometheus.yml,主要有两个步骤:
- 对Alertmanager进行配置,填写alerting对应的targets地址(本文的Alertmanager和Prometheus安装在同一台机子上),例如localhost:9093,默认的端口为9093。
# Alertmanager configuration
alerting:
  alertmanagers:
  - static_configs:
    - targets: [localhost:9093]
      # - alertmanager:9093
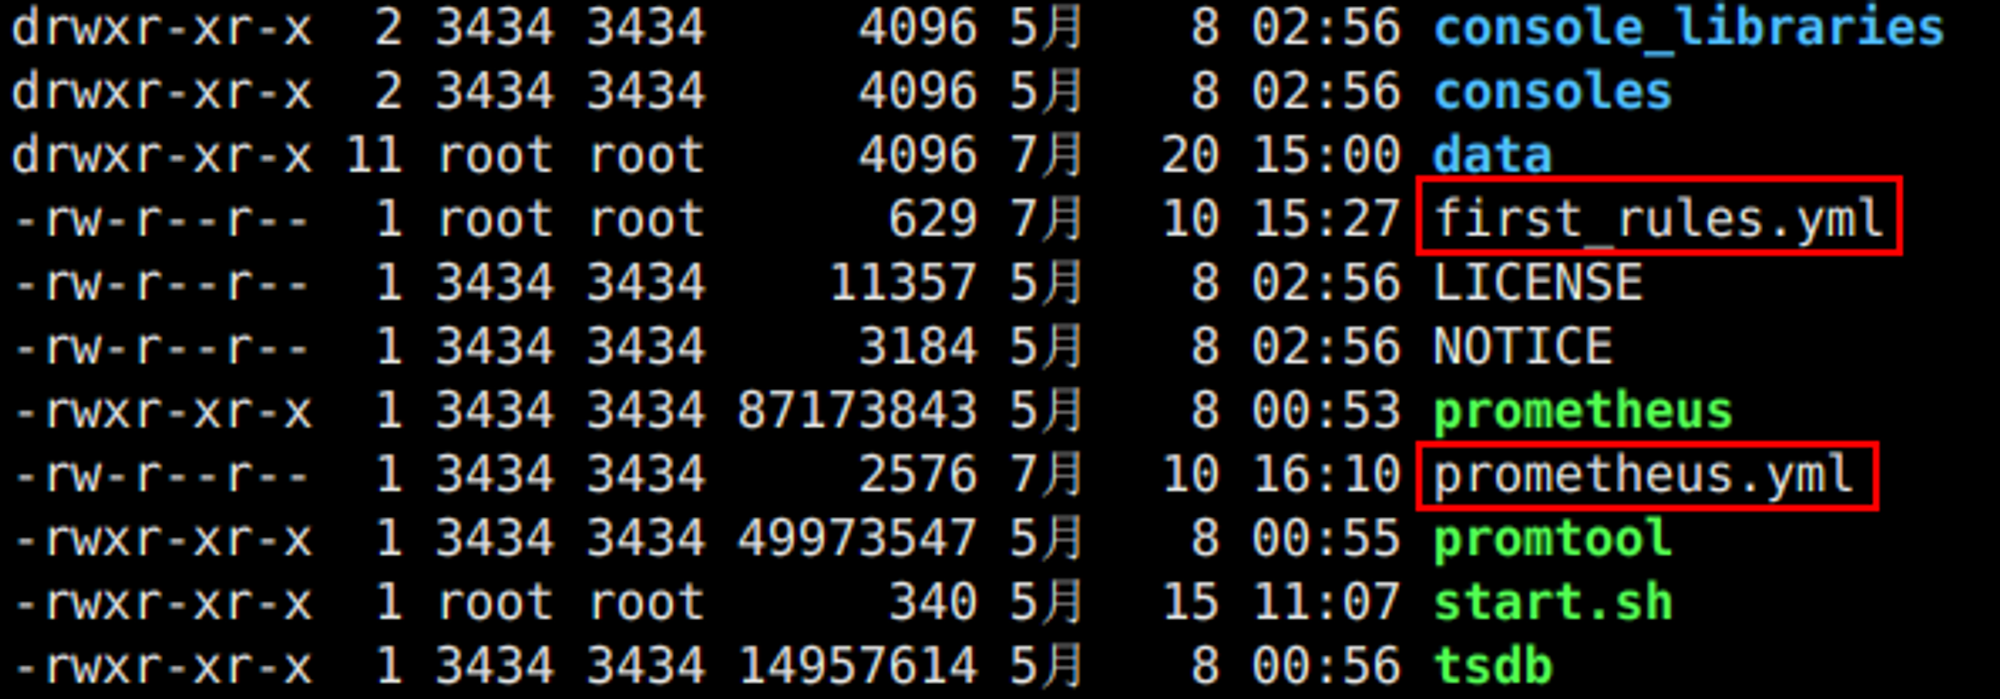
2. 添加规则文件first_rules.ymlfirst_rules.yml与prometheus.yaml同一个目录下,也可以放置其他位置。如果放置在其他目录需要指定该目录,让Alertmanager能找到该规则文件。
rule_files:
   - "first_rules.yml"
  # - "second_rules.yml"
AlterManager
Alertmanager是一个独立的告警模块,接收Prometheus等客户端发来的警报,之后通过分组、删除重复等处理,并将它们通过路由发送给正确的接收器;告警方式可以按照不同的规则发送给不同的模块负责人,Alertmanager支持Email, Slack,等告警方式, 也可以通过webhook接入钉钉等国内IM工具。
下载地址


配置first_rules.yml,在告警规则文件中,我们可以将一组相关的规则设置定义在一个group下。在每一个group中我们可以定义多个告警规则(rule)。一条告警规则主要由以下几部分组成:
- alert:告警规则的名称。
- expr:基于PromQL表达式告警触发条件,用于计算是否有时间序列满足该条件。
- for:评估等待时间,可选参数。用于表示只有当触发条件持续一段时间后才发送告警。在等待期间新产生告警的状态为pending。
- labels:自定义标签,允许用户指定要附加到告警上的一组附加标签。
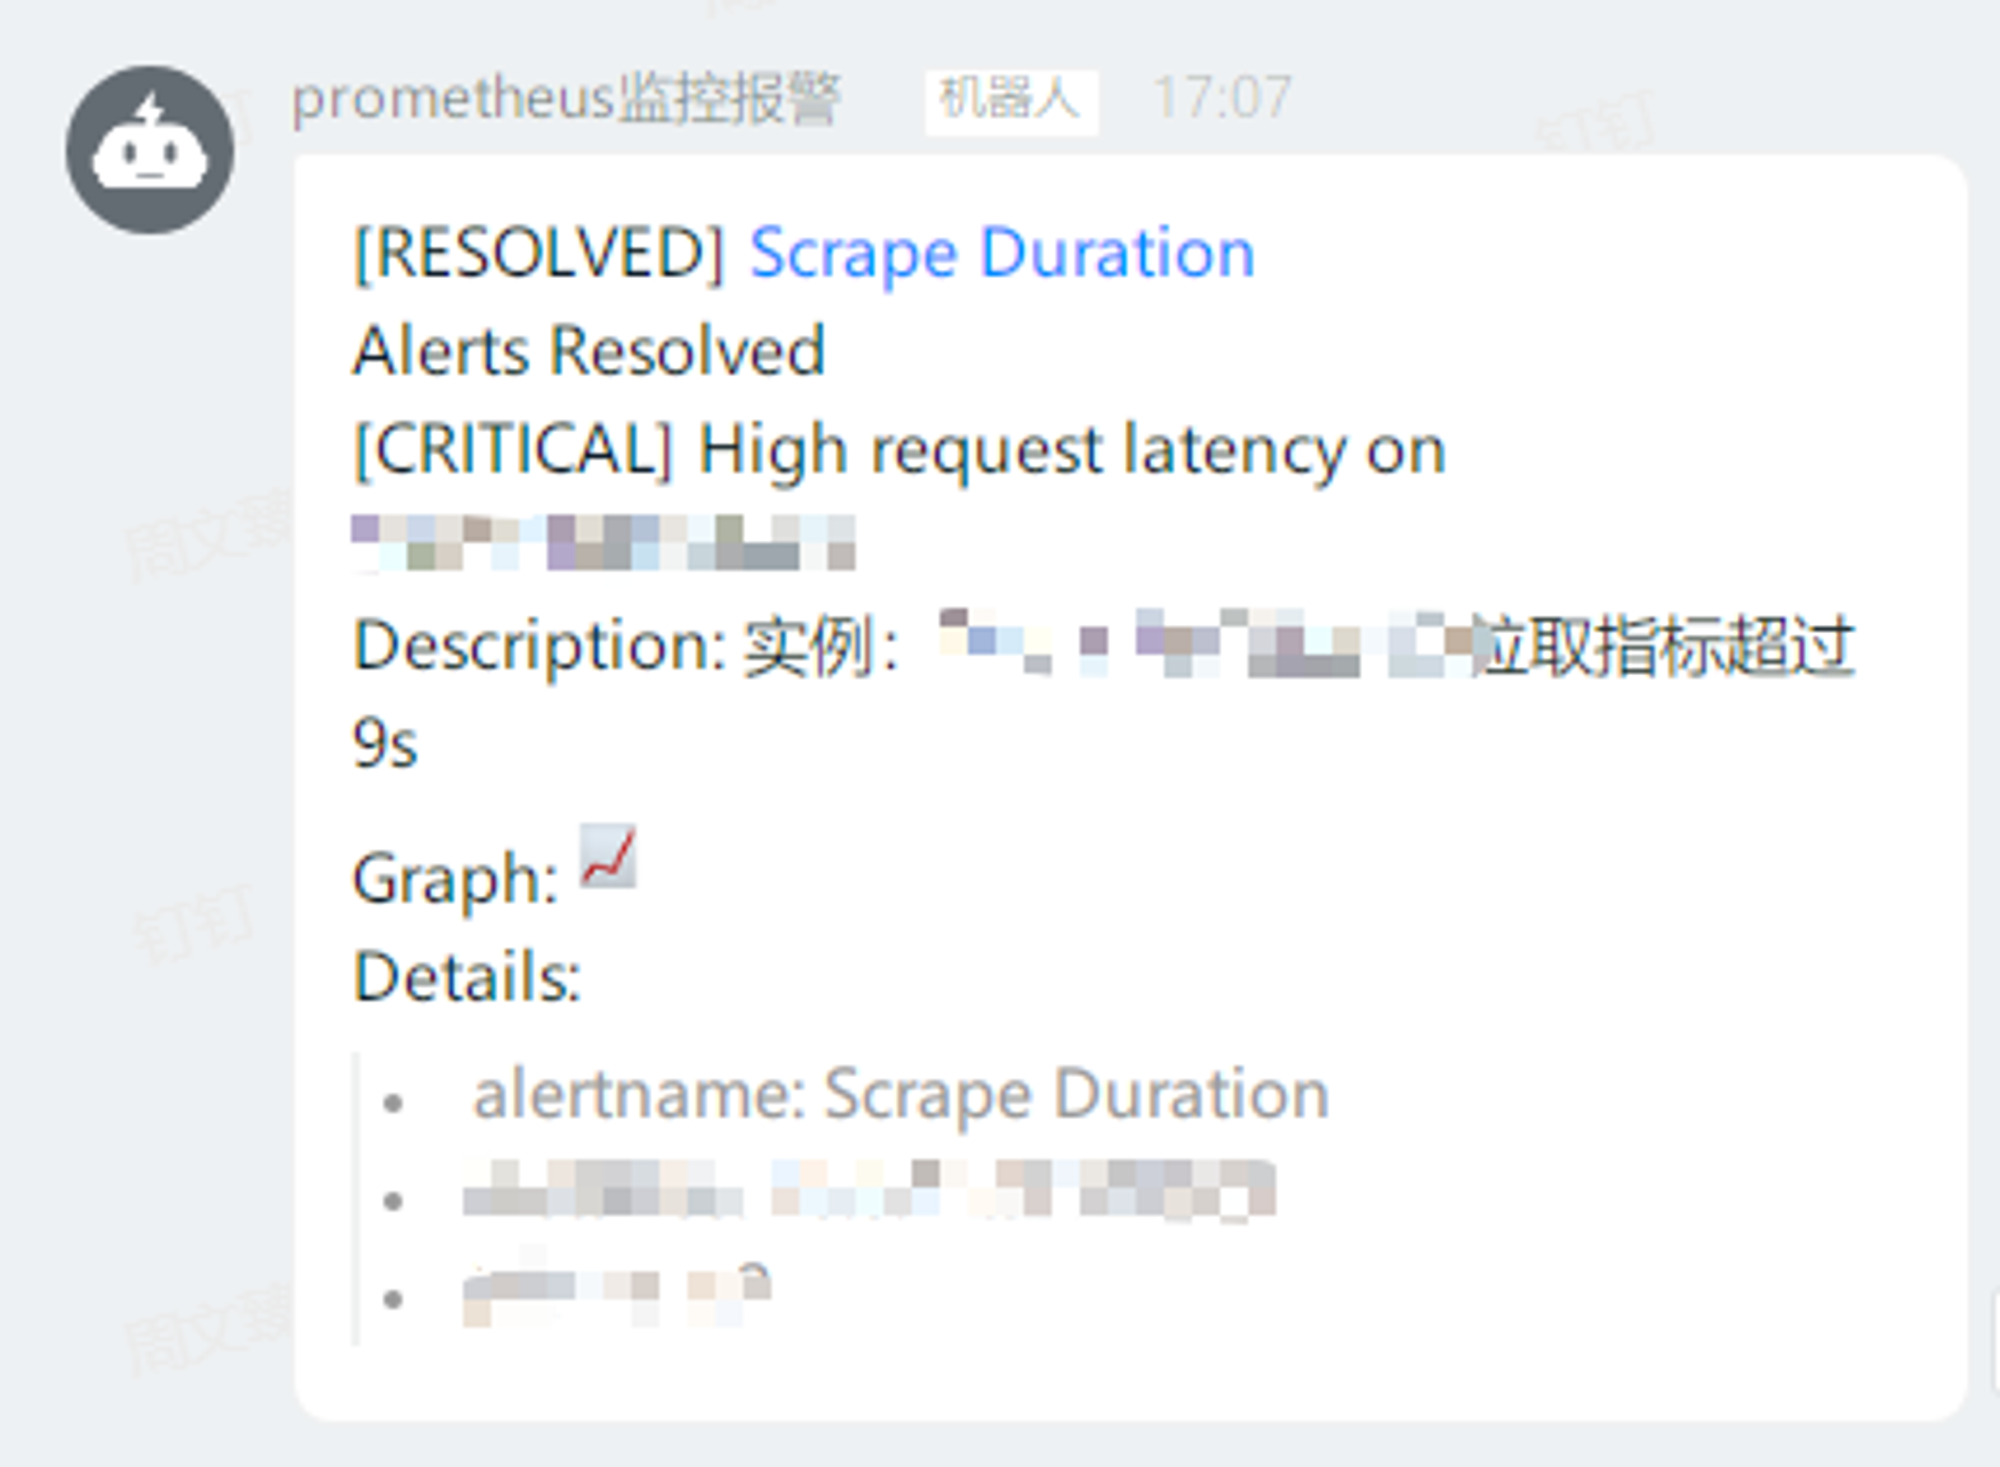
- annotations:用于指定一组附加信息,比如用于描述告警详细信息的文字等,annotations的内容在告警产生时会一同作为参数发送到Alertmanager。summary描述告警的概要信息,description用于描述告警的详细信息。同时Alertmanager的UI也会根据这两个标签值,显示告警信息。
比如监控应用是否宕机:
groups:
  - name: example
    rules:
    - alert: Server Down
      expr: up{job="xxx"} == 0
      for: 10s
      labels:
        severity: critical
      annotations:
        description: "实例:{{ $labels.instance }} 宕机了"
        summary: "Instance {{ $labels.instance }} down"
配置alertmanager.yml
global:
  resolve_timeout: 5m

route:
  group_by: ['alertname']
  group_wait: 10s
  group_interval: 10s
  repeat_interval: 1h
  receiver: 'ops_dingding' #和receivers中定义的name对应

receivers:
- name: 'ops_dingding'
  webhook_configs:
  - url: 'http://localhost:8060/dingtalk/webhook1/send' #prometheus_webhook_dingtalk启动后从日志中可以看到用于接收告警信息的webhook的地址
    send_resolved: true

inhibit_rules:
  - source_match:
      severity: 'critical'
    target_match:
      severity: 'warning'
    equal: ['alertname', 'dev', 'instance']
同样使用Supervisor启动Alertmanager,进入supervisor安装目录,在conf.d/下新建alertmanager.conf
vim alertmanager.conf
配置alertmanager.conf
- /xxx/alertmanager/alertmanager:alertmanager启动脚本路径
- -config.file:启动的配置文件
#!bin/sh
[program:alertmanager]

command  = /xxx/alertmanager/alertmanager --config.file=/xxx/alertmanager/alertmanager.yml
directory = /xxx/alertmanager
user = root
startsecs = 5

redirect_stderr = true
stdout_logfile_maxbytes = 10MB
stdout_logfile_backups  = 3
stdout_logfile = /xxx/supervisor/logs/alertmanager.log
autostart=true
autorestart=true
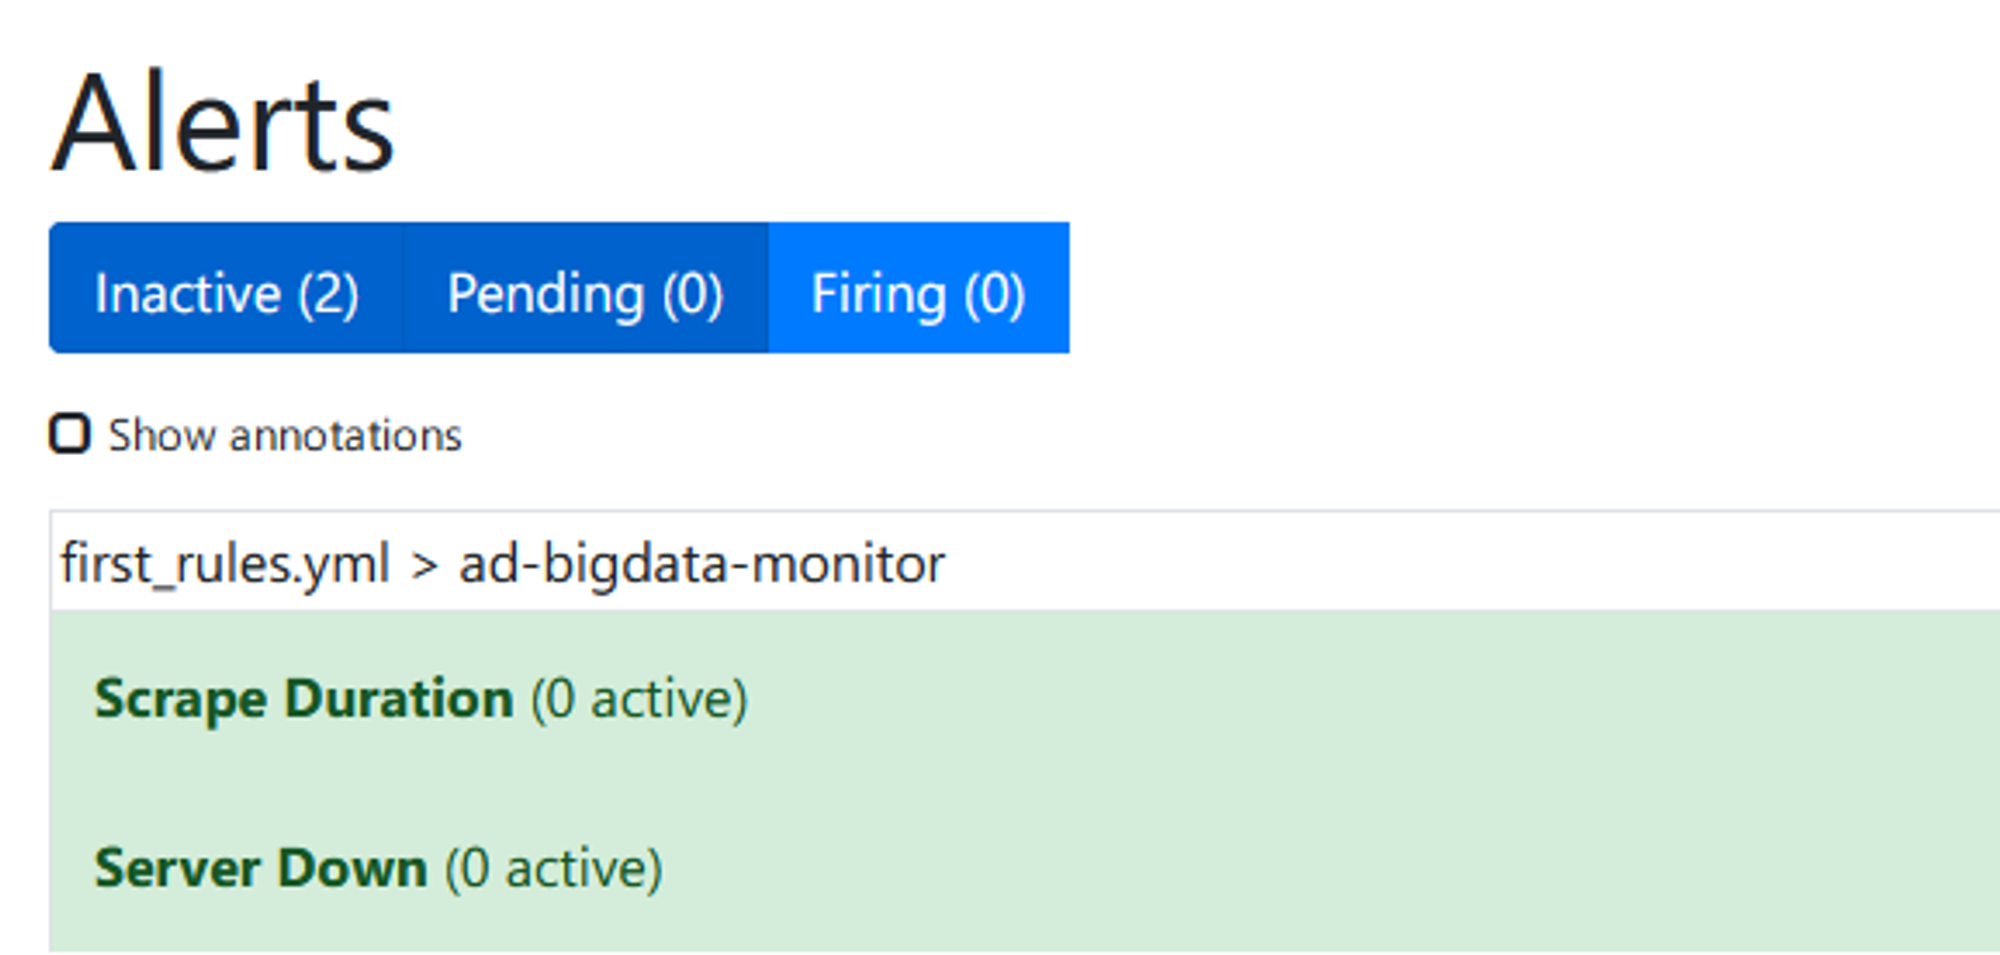
在确保上面的配置无误后,就可以重启Prometheus了。重启进入Prometheus后在Alerts中可以看到之前定义的告警规则已激活。